Introduction to Geospatial Data domain with Emphasis on Satellite and UAV Imagery for Data Engineers and Data Scientists
Audio Version 
For those who cannot or choose not to read this page, I have included an audio version of this blog post. What’s particularly exciting is that you may recognize the voice of Neil deGrasse Tyson, the renowned astrophysicist whom I greatly admire. Of course, I would feel unworthy to request that Mr. Tyson read and record this blog, so I used AI to assist me ![]() . I utilized the AI technology of one of the best companies in this field, Eleven Lab, to create an AI voice replica from just a three-minute clip of Mr. Tyson speaking
. I utilized the AI technology of one of the best companies in this field, Eleven Lab, to create an AI voice replica from just a three-minute clip of Mr. Tyson speaking ![]() , and instructed it to read mthe blog.
, and instructed it to read mthe blog.
I have reached out to Mr. Tyson to obtain permission to publish the entire audio, and as a teaser, I am sharing only the introduction section. I hope you enjoy it, and that Mr. Tyson agrees to share the whole recording.
Some Treats  from the World of AI
Before we dive into the main topic of this post, I would like to introduce you to ControlNet, a powerful model that uses Stable Diffusion to provide more control in image generation. You can input scribes, edges maps, etc, and ControlNet will attempt to produce images that reflect your input. For more information on this model, check out the paper here: ControlNet ![]() . However, if you are new to this topic, I advise visiting the Stability AI blog to learn about Stable Diffusion
. However, if you are new to this topic, I advise visiting the Stability AI blog to learn about Stable Diffusion ![]() .
.
In Figure 1, you can see some examples of images I created using the Hugging Face app ![]() with ControlNet. I used a magnificent photo of myself I took while attending the WACV conference in Hawaii
with ControlNet. I used a magnificent photo of myself I took while attending the WACV conference in Hawaii ![]() . Please note that I used parameters that gave me the lowest inference time to generate these images, but with better tweaks and adjustments, it’s possible to create even more realistic pictures that are on par with Stable Diffusion images. Now, let’s move on to the main topic of this post.
. Please note that I used parameters that gave me the lowest inference time to generate these images, but with better tweaks and adjustments, it’s possible to create even more realistic pictures that are on par with Stable Diffusion images. Now, let’s move on to the main topic of this post.

Figure 1 presents the original image and two digital images created using ControlNet. The middle image was generated based on canny edges of the left image without any prompt, while the right image was created using pose estimation of the left image with the prompt "Data Scientist on the beach".
Introduction 
If you’re a data scientist, machine learning engineer, or data engineer looking to work with satellite and drone images, you’ve come to the right place 👊. In this article, I will focus on basic concepts and data structures needed for machine learning and computer vision engineers to work with geospatial data from satellite imagery, Earth observation (EO) and unmanned aerial vehicles (UAV).
Please note that while I will touch on geo-informatics and GIS, this is not the main focus of the article. Instead, I will provide some basic information and recommend articles and interactive books for further reading on these topics.
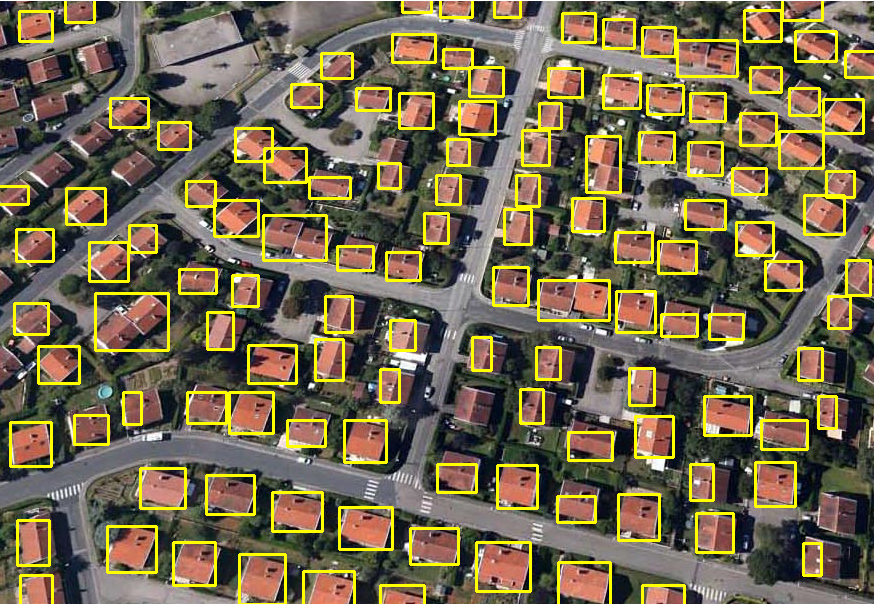
Figure 2 Building detection results taken from this Github project.
GIS/Geography and Spatial Data Science
If you’re interested in using spatial data to gain insights into patterns and processes, you may be interested in GIS and Geography, two related fields that focus on spatial data analysis.
GIS (Geographic Information System) is a system used to capture, store, manipulate, analyze, and present spatial or geographic data, while Geography is a broader field that studies the physical and human aspects of the earth’s surface, including their spatial relationships.
Spatial Data Science is an interdisciplinary field that combines GIS, computer science, statistics, and machine learning to analyze large and complex spatial datasets. It focuses on developing and applying computational and statistical methods to gain insights into spatial patterns and processes and to inform decision-making.
If you’re interested in learning more about geography and spatial data science, I encourage you to check out this Jupyter Book ![]() that showcases their applications and the tools/algorithms primarily written in Python. The book provides many examples and code snippets, but some pages can be lengthy, making it difficult to read at times. However, it is still worth the effort.
that showcases their applications and the tools/algorithms primarily written in Python. The book provides many examples and code snippets, but some pages can be lengthy, making it difficult to read at times. However, it is still worth the effort.
Additionally, it’s always helpful to see how spatial data can be applied in practice. Take a look at how Burger King used geospatial data to become the leader in fast food in Mexico City a few years ago:
Figure 3 Burger King traffic video. Click on the image to view the video
For starters, you can also start working on projects such as Geographic Change Detection, Modeling Bike Ride Requests, Transport Demand Modeling, or Spatial Inequality Analysis.
If you want to learn more about modern geospatial approaches, I recommend reading How to Learn Geospatial Data Science in 2023, which provides insights and tips on how to get started in this field. Additionally, this source provides a wealth of content for aspiring GIS professionals.
In my opinion, learning Python geospatial data science is likely to be more in demand in the future, as Python is a popular language for AI and there is a big community with a lot of new tools. However, GIS and R are still regularly used today. This is just my intuition and opinion, but if I were to pursue this field, I would focus on python geospatial data science ![]() .
.
Main dish  - Satellite Imagery
As I mentioned in the beginning, I will be focusing on satellite (and drone) images as it is a more applicable path for my skills in computer vision. I assume that you are already familiar with the field of computer vision and know what these tasks look like. If not, I recommend you to check, for example this blog ![]() first before you continue reading.
first before you continue reading.
Satellite and drone images differ from other types of data that computer vision programmers usually work with, because they are often nadir (explained latter) format photos taken from the sky. From these photos, we can try to detect spatial features and generally do some object detection or segmentation for further analysis.
Object detection in UAV images can be challenging for a few reasons. First, let’s discuss satellite images. Most satellite images are already calibrated, meaning that they are nadir format and stitched together to create a map covering vast land cover. The first problem we will encounter is the resolution of these images, which is called Ground Sample Distance (GSD).
GSD is the size of one pixel in an image, measured in meters on the ground. GSD is determined by the sensor resolution and altitude of the satellite or drone. The smaller the GSD, the higher the resolution of the image.
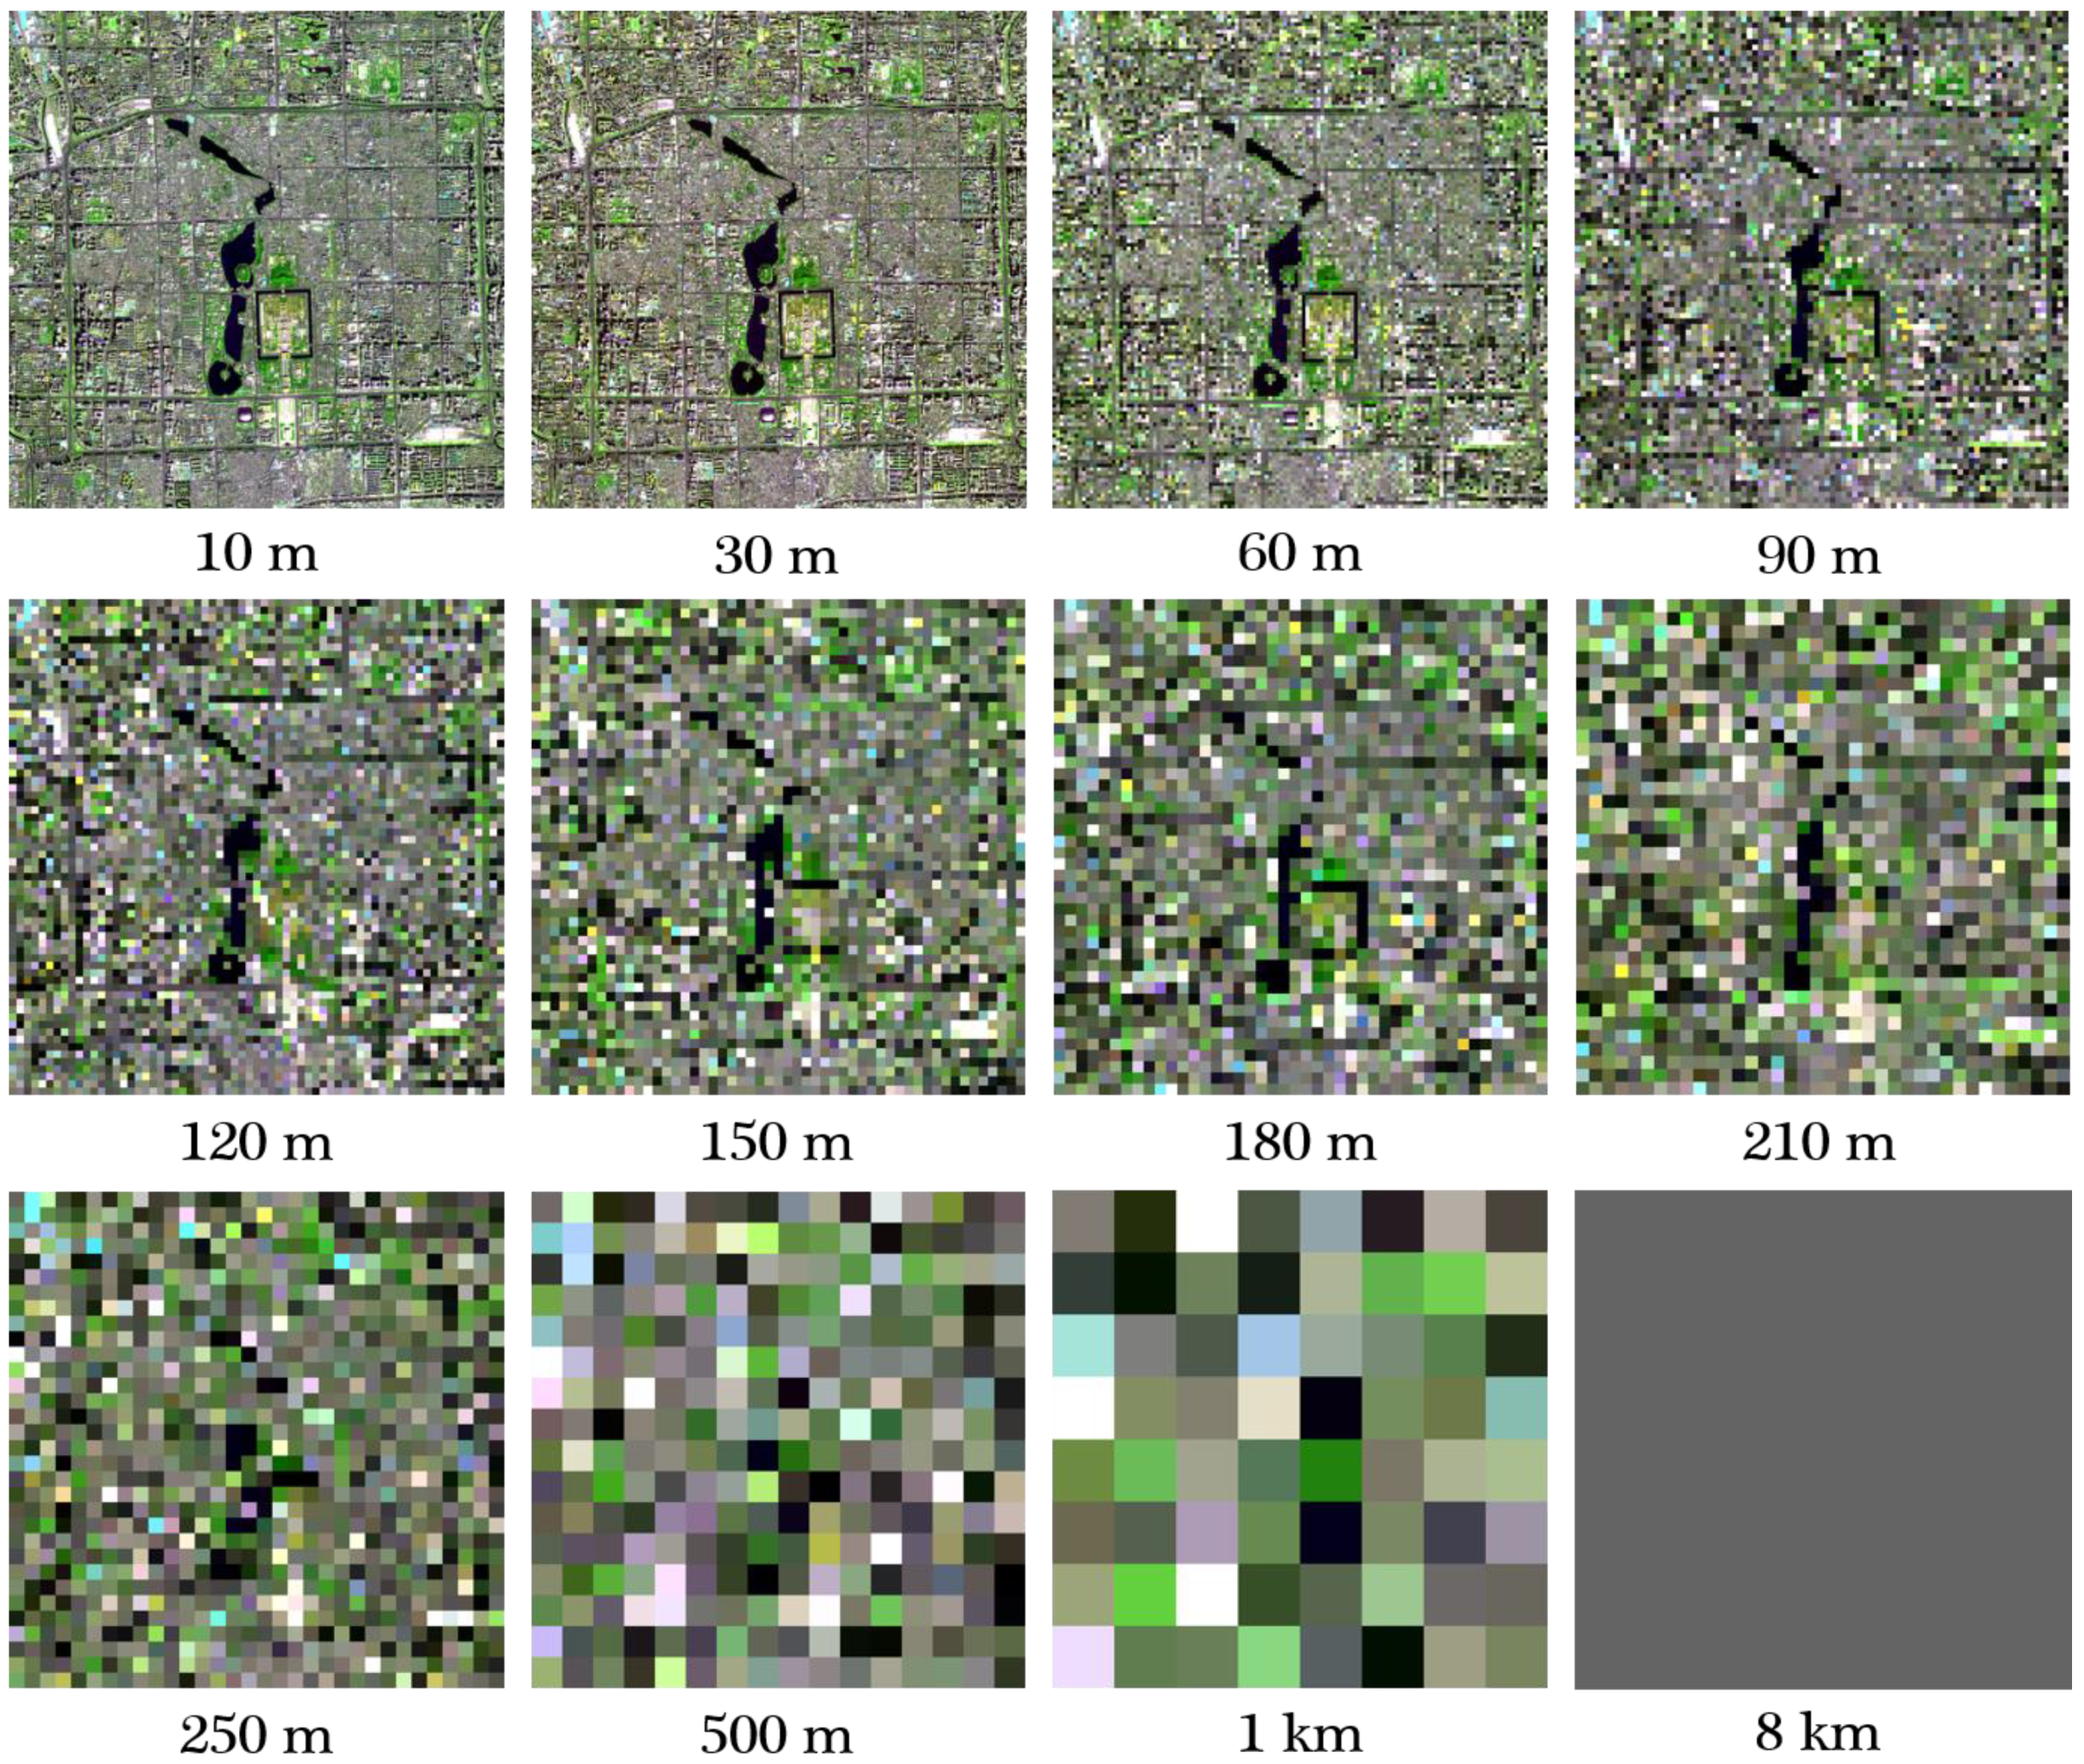
Figure 4 Comparison of different spatial resolutions (GSD).
However, detecting small objects can be challenging when the Ground Sampling Distance (GSD) is high. On the other hand, when the GSD is low, we need to zoom in more as we essentially work with images around 512x512 rather than 2048x2048. Consequently, we may miss some objects, or when using AI to detect, analyze an image without all the critical features included. Therefore, we need to adjust the resizing and zooming parameters accordingly.
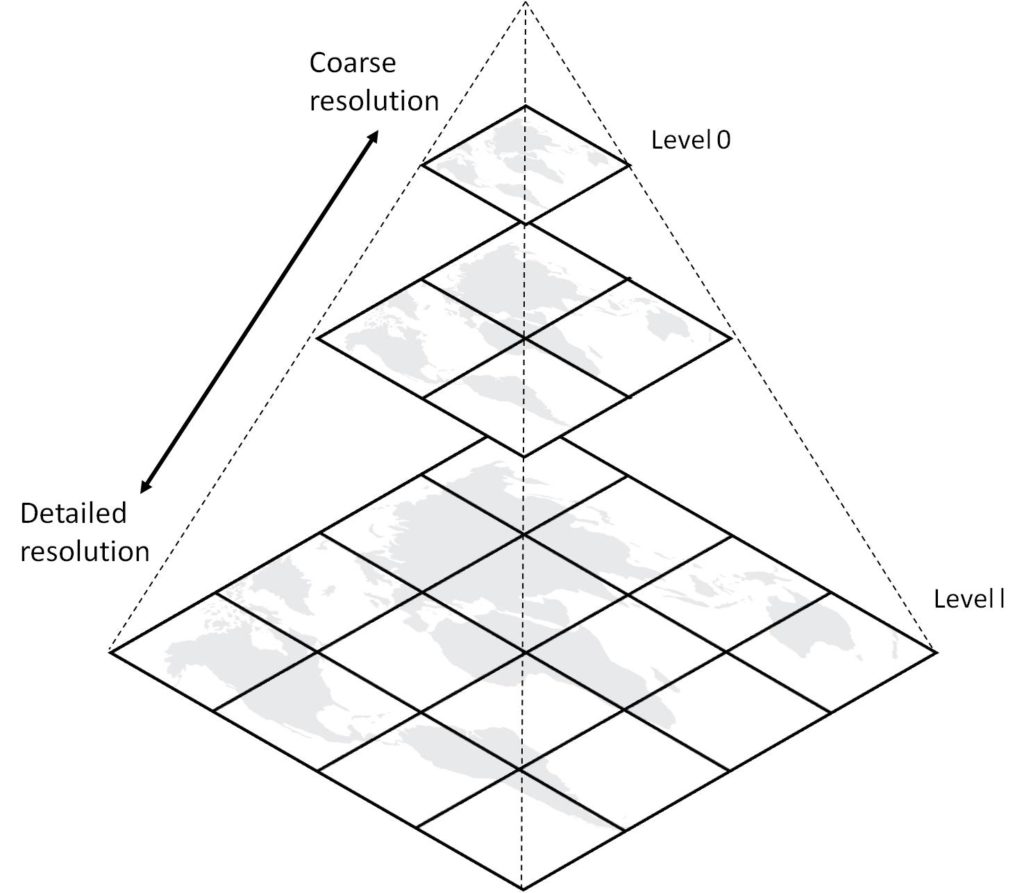
Figure 5 Spatial images tile pyramid.
An approach that I liked for dealing with small objects in object detection is not to detect but to estimate how many objects are in some grid box of the image. It will give less information, but it will be more accurate for small objects or small resolution images. Here is the medium paper ![]() presenting such solution for detecting trees. If you still would want to detect and not estimate small objects maybe this solution SAHI
presenting such solution for detecting trees. If you still would want to detect and not estimate small objects maybe this solution SAHI ![]() may help you achieve it at inference.
may help you achieve it at inference.
The second major problem are clouds and cloud shades ![]() . Images from satellites or planes often contain clouds that cover the land, making it impossible to detect objects in those images, or there may be cloud shadows that make predictions difficult. There are algorithms attempting to address this issue, and research is still ongoing in this field. I advise you to look into this paper dataset
. Images from satellites or planes often contain clouds that cover the land, making it impossible to detect objects in those images, or there may be cloud shadows that make predictions difficult. There are algorithms attempting to address this issue, and research is still ongoing in this field. I advise you to look into this paper dataset ![]() about cloud satellite data.
about cloud satellite data.
In the case of segmentation, we have all the problems mentioned (clouds, resolution), and additionally, we can have problems with inconsistent predictions. For example, with line segmentation/detection or building segmentation, the masks will often not have consistent lines or structures. However, with post-processing, you can apply some treatment to it.
Now, let’s talk about the temporal aspect. You need to understand that depending on the satellites, images taken of the globe are not all taken at the same time. Thus, some time shifts can happen, and it is even more problematic if you want to combine data from other satellites. They will not align in time, which can be very problematic when one satellite image shows a region without clouds and another shows the same region with clouds, or when there are significant changes in the spatial layout between the images.
Optical Satellite Aspects
Data obtained from the satellites are not as simple as those obtained from our iphone or cameras, majorly due to optical spectrum. The RGB spectrum that we see is not only thing that can be seen, however, our eyes only capture this, so why cameras need to capture more?
Sometimes we would like to see or analyse data from a different spectrum, for example, often in films soldiers use infrared goggles to see in the dark, because it allows to see the emission of the heat from objects. Capturing data from a wider range of the electromagnetic spectrum can give us more information about some biological processes that we can’t see with just that small band spectrum RGB.

Figure 6 Spectral bands that satellite data often contains.
Let’s examine the satellite bands captured by Sentinel-2. Sentinel-2 is an Earth Observation mission of the European Union that comprises two identical satellites, Sentinel-2A and Sentinel-2B. The article provides information on which bands are collected by the satellites and what information they can provide. It also explains how certain combinations of bands can provide additional insights.
Sentinel data is preprocessed for users, but it’s possible to obtain the version before preprocessing as well. Understanding how the data is preprocessed is essential since different satellite data providers may include or exclude certain preprocessing steps. To provide readers with more information, we recommend referring to an example of Sentinel-2 data preprocessing.
There are also satellite SAR images that refer to images acquired by Synthetic Aperture Radar (SAR) systems onboard Earth observation satellites. SAR is a remote sensing technology that uses radar to generate high-resolution images of the Earth’s surface, regardless of weather or lighting conditions.
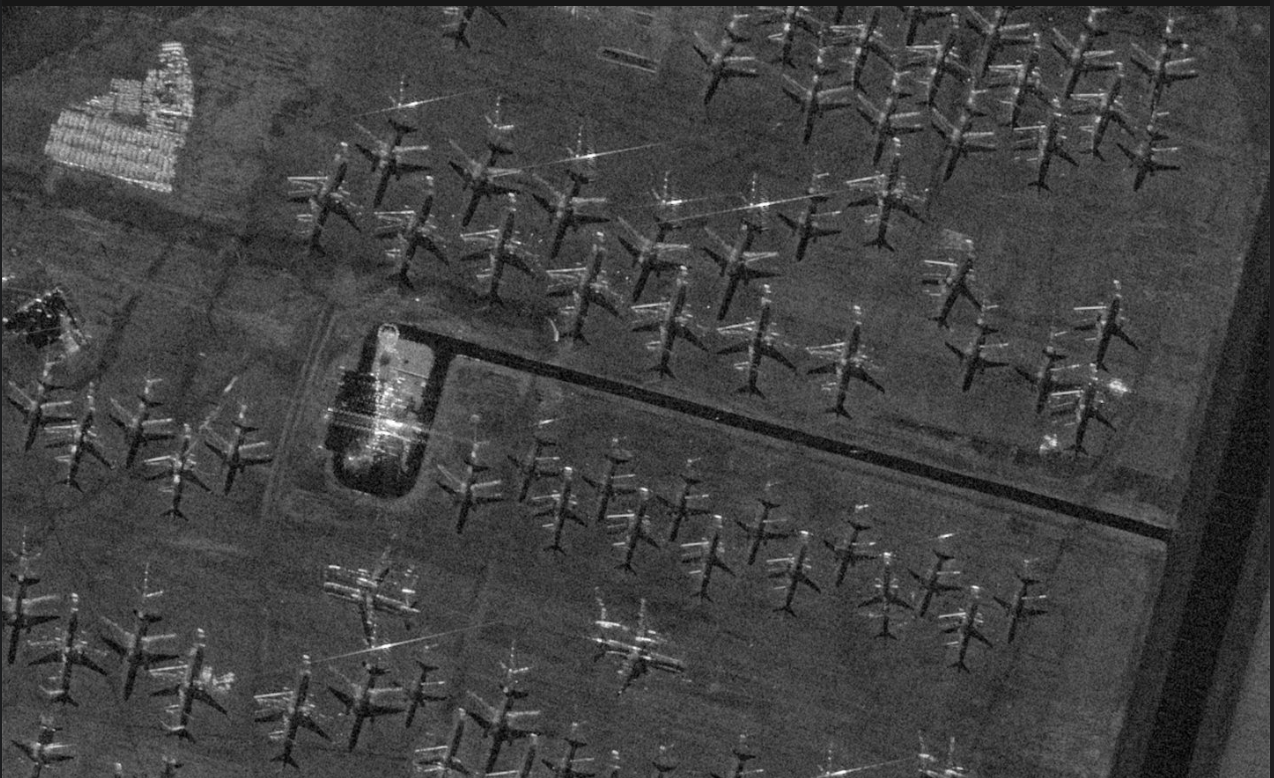
Figure 7 Satellite SAR image.
SAR can generate images with high spatial resolution and accuracy. SAR can also penetrate through clouds, vegetation, and other obstacles, which makes it ideal for applications such as mapping forest cover, monitoring glaciers and ice sheets, and tracking ocean waves and currents.
Other Satellite Aspects to Know
While I previously mentioned the images are preprocessed, it’s important to note that not all preprocessing steps may be done and you should also understand what needs to be done. The first step is an illumination correction. Illumination refers to the amount and direction of light falling on the Earth’s surface when a satellite image is captured. The illumination conditions at the time of image capture can impact the appearance of features on the image, especially those with high relief or slope.
The next aspect you need to understand is orthorectification. This is the process of removing geometric distortions from an image caused by the Earth’s curvature, terrain relief, and sensor perspective. It involves reprojecting the image onto a flat surface, using ground control points to correct for distortions.
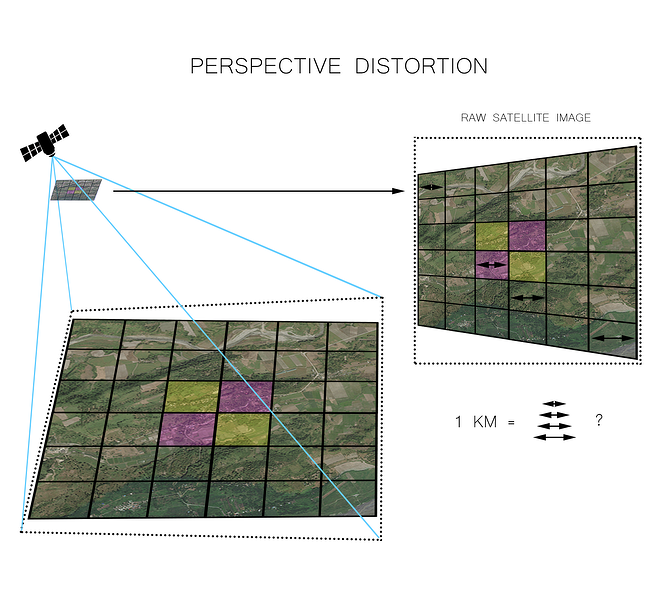
Figure 8 Orthorectification: the process of removing geometric distortions from an image caused by the Earth's curvature.
Finally, it’s essential to understand the geographical metadata that is often provided with satellite images, such as azimuth and altitude. Azimuth refers to the angle between true north and the direction to a point of interest, while altitude refers to the orientation of a satellite or sensor relative to the Earth’s surface. This information, along with geographical positioning, is critical for interpreting satellite images from a geographical perspective.

Figure 9 The azimuth is the angle formed between a reference direction (in this example north) and a line from the observer to a point of interest projected on the same plane as the reference direction orthogonal to the zenith.
UAV Images
Satellite images are usually well-prepared, but images from drones and planes can be more challenging to work with. These images might not be taken from a straight-down perspective (known as nadir format), and they might not be in the same coordinate system as maps. To make these images usable, we need to re-project them and stitch them together.
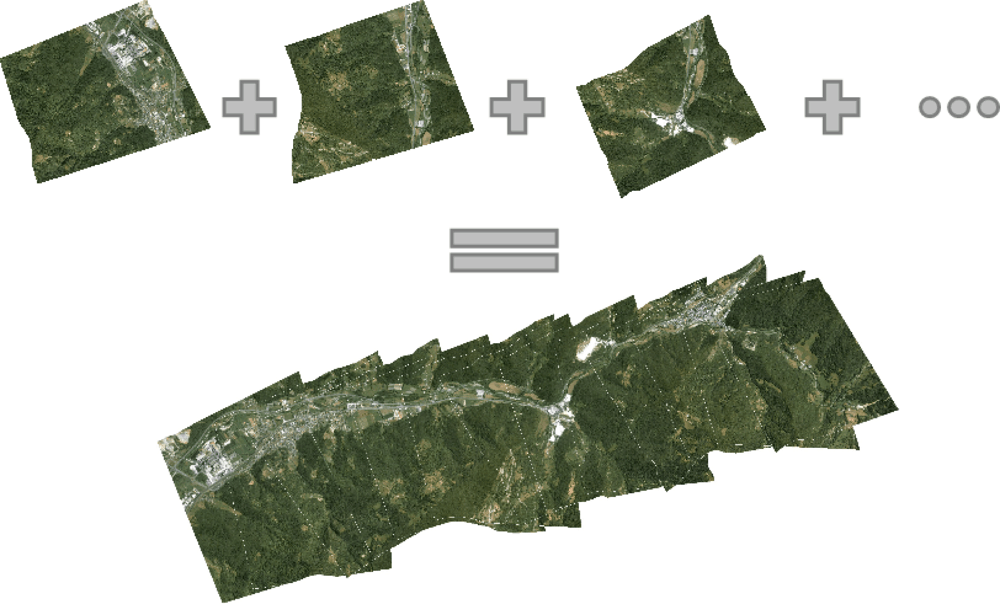
Figure 10 process of stitching images taken from drone to one image.
UAV Image Pre and Post Processing
Before we can analyze the images from UAVs, we need to prepare them by stitching them together to remove unnecessary data and create a seamless image. This process is known as Orthomosaic Generation and is also used in SLAM (Simultaneous Localization and Mapping). The process involves several steps, including image calibration, feature detection, feature matching, global alignment, and blending.
Image calibration ![]() -> Feature detection
-> Feature detection ![]() -> Feature matching (translation estimation)
-> Feature matching (translation estimation) ![]() -> Global alignment
-> Global alignment ![]() -> Blending
-> Blending ![]()
Now let’s discuse each step shortly. Image calibration ![]() is a process that involves correcting the distortions that may be present in the UAV images due to lens aberration, sensor misalignment, or atmospheric effects. Image calibration includes operations such as radiometric correction, geometric correction, and color balancing to ensure that the images are accurate and consistent. Read more about it in this opencv blog called image calibration and in this article showing how it is done for UAV images.
is a process that involves correcting the distortions that may be present in the UAV images due to lens aberration, sensor misalignment, or atmospheric effects. Image calibration includes operations such as radiometric correction, geometric correction, and color balancing to ensure that the images are accurate and consistent. Read more about it in this opencv blog called image calibration and in this article showing how it is done for UAV images.
Feature detection ![]() is the process of identifying important features or points of interest in UAV images. This can include things like corners, edges, and distinct shapes. Common feature detection techniques include corner detection, edge detection, and blob detection. Some common algorithms used for feature detection are SIRF, SURF, and ORB (medium paper
is the process of identifying important features or points of interest in UAV images. This can include things like corners, edges, and distinct shapes. Common feature detection techniques include corner detection, edge detection, and blob detection. Some common algorithms used for feature detection are SIRF, SURF, and ORB (medium paper ![]() comparing those methods).
comparing those methods).
After detecting features in UAV images, they need to be (feature) matched ![]() across multiple images to determine their corresponding positions. Feature matching involves computing the similarity between features in different images and estimating the translation between images. This process typically uses the RANSAC algorithm.
across multiple images to determine their corresponding positions. Feature matching involves computing the similarity between features in different images and estimating the translation between images. This process typically uses the RANSAC algorithm.
Global alignment ![]() is the process of aligning all the UAV images to a common coordinate system, so they can be accurately compared and analyzed. This is done using ground control points (GCPs) or other reference data. The global alignment process accounts for any differences in orientation, scale, or perspective between the images, to create a seamless and accurate image.
is the process of aligning all the UAV images to a common coordinate system, so they can be accurately compared and analyzed. This is done using ground control points (GCPs) or other reference data. The global alignment process accounts for any differences in orientation, scale, or perspective between the images, to create a seamless and accurate image.
Blending ![]() : The final step in UAV image processing is to blend the aligned images into a seamless mosaic or orthomosaic. This involves adjusting the brightness and color balance of the images to create a visually appealing and geographically accurate representation of the UAV survey area. Image Blending often uses Pyramids for this task.
: The final step in UAV image processing is to blend the aligned images into a seamless mosaic or orthomosaic. This involves adjusting the brightness and color balance of the images to create a visually appealing and geographically accurate representation of the UAV survey area. Image Blending often uses Pyramids for this task.

Figure 11 Image blending where apple should be the left part of the final image and orange in the right part.
However, since I do not have much experience in this field, I am not certain about all the necessary steps involved in UAV image processing or which steps are typically handled by data scientists or data engineers. From what I understand, UAV images are often already calibrated and provided with GPS data, so calibration and alignment may not be necessary. However, feature detection, matching, and blending may still need to be performed, and the difficulty of these tasks may depend on the information provided by the UAV.
In terms of data pipeline, I have mostly come across the use of serverless cloud computing such as AWS Lambda functions and EC2 instances to handle these tasks. To tackle this, I would start by exploring the OpenDroneMap open-source toolkit and then look for similar stories and tools online.
Satellite Data Structures
Before I finish the first part of this blog (yes there will be a next part ![]() ), which mostly focuses on concepts in satellite and UAV images, I want to discuss data structures used with satellite data, specifically how this data is stored and read.
), which mostly focuses on concepts in satellite and UAV images, I want to discuss data structures used with satellite data, specifically how this data is stored and read.
Firstly, before focusing on satellite images, I need to mention that geospatial data is mostly stored in two data structures: shapes and rasters. Rasters, are just images of the earth with various spectral resolutions, not only RGB. However, if you go to OpenStreetMaps, you will mainly see some shapes and not images because it is less memory-consuming to store shapes such as lines, points, or polygons. We can often refer to the earth image through a Coordinate Reference System (CRS), which is a method used to describe and locate features on the surface of the Earth. Thus, sometimes we store data as shapes and not only rasters.
Vector Spatial Structures
Shapes are often stored in the shapefiles (.shp/.shx/.dbf) format. This format was developed by the Environmental Systems Research Institute (ESRI) and is now widely used by many GIS software applications. The structure of a Shapefile is organized into three main components: header, record, and geometry. The header contains information about the file, including the shape type, bounding box, and projection information. The record describes the attributes associated with a feature, such as the name, population, or elevation. The geometry contains the spatial location and shape of the feature, such as a point or a polygon.
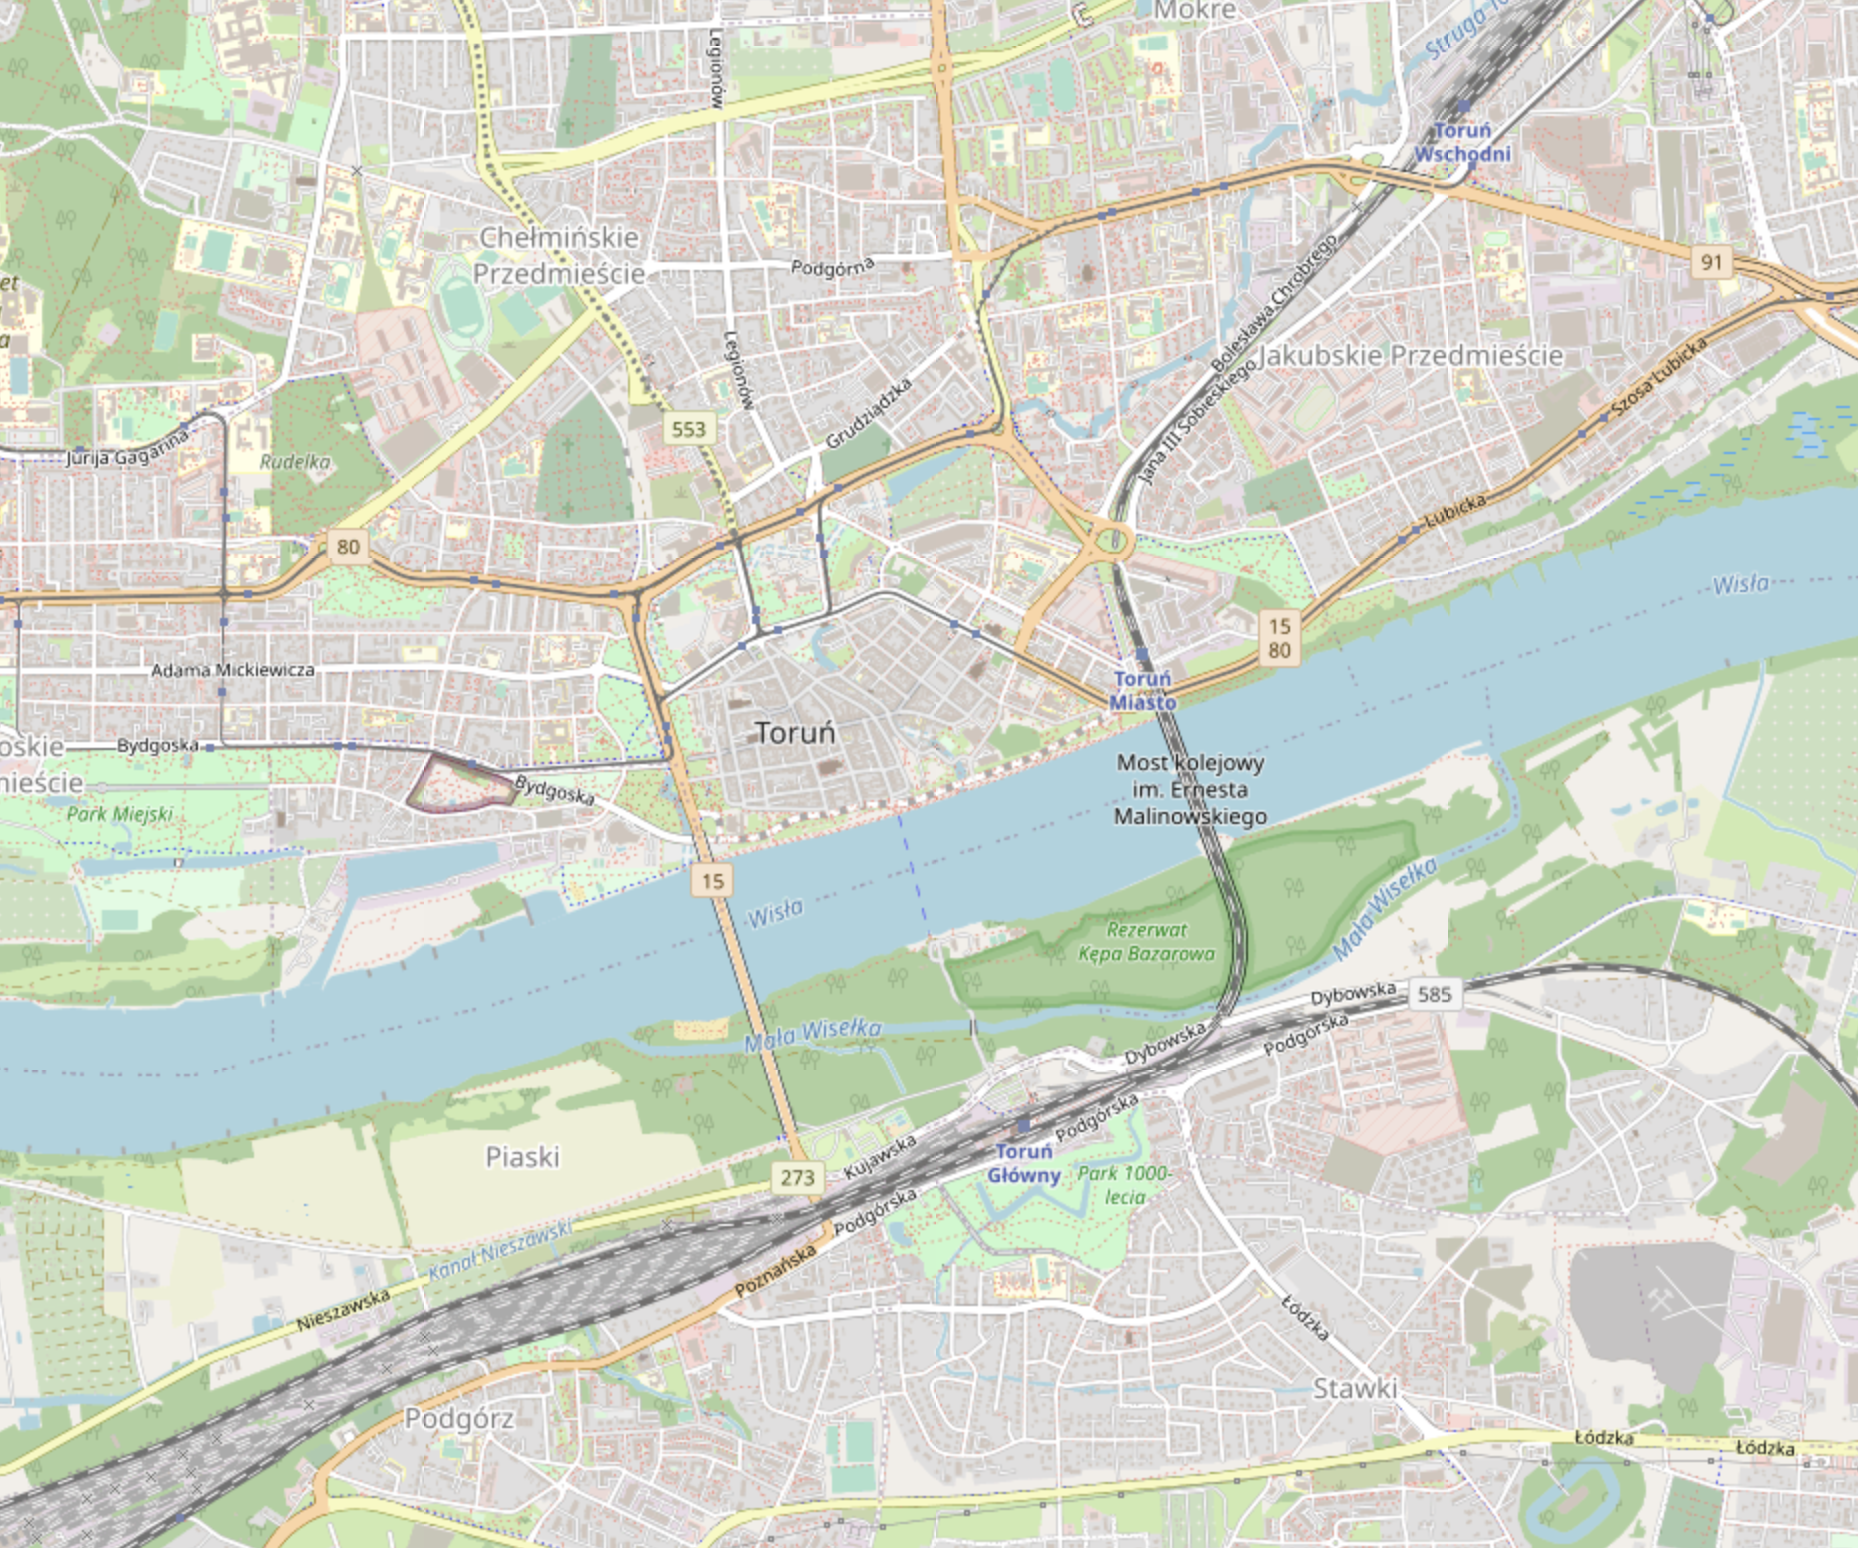
Figure 12 Open Street Map of my city. It is mostly constructed with vector structures such as lines and polygons.
The second widely used format is GeoJSON, which is based on the popular file format JSON. It is a lightweight, text-based format designed to represent simple or complex geometries, including points, lines, polygons, and multi-geometries, along with their associated properties. It is supported by many GIS software applications and web mapping platforms, such as Google Maps and Leaflet.
Comparing the two formats, I would choose GeoJSON due to a few reasons. Shapefiles consist of multiple files, including a main file for geometry, an index file, and a database file for attributes. In contrast, GeoJSON is a single file format that includes both the geometry and attributes in one file. GeoJSON is faster. Shapefiles support a wide range of geometry types, including points, lines, and polygons, while GeoJSON also supports these geometry types as well as more complex geometries like multipoints, multilines, and multipolygons. GeoJSON has the advantage of being more flexible and easier to use with web applications.
There also exist Well-Known Text (WKT) and Well-Known Binary (WKB), common text-based and binary-based formats, respectively, for representing spatial data in a standardized format. In terms of usage, WKT and WKB are primarily used for exchanging spatial data between different software applications, while GeoJSON and Shapefile are commonly used for storing and sharing spatial data within GIS applications.
Summarizing, GeoJSON formats are the most commonly used formats as they are in JSON format, which is widely used and developed across many developer fields. Shapefile is older, however, still used, and WKT and WKB are simple structures that are great to use when using different software applications. Nowadays, the most popular libraries and frameworks primarily try to support GeoJSON.
Raster Spatial Structures
The second type of data structures used in Earth observation (EO) are raster data, which are simply a pixel grid representation (similar to the photos taken by an phones). The term “raster” is used instead of images due to the fact that normal images have a spatial resolution of RGB, whereas satellite images are not bound to only this resolution.
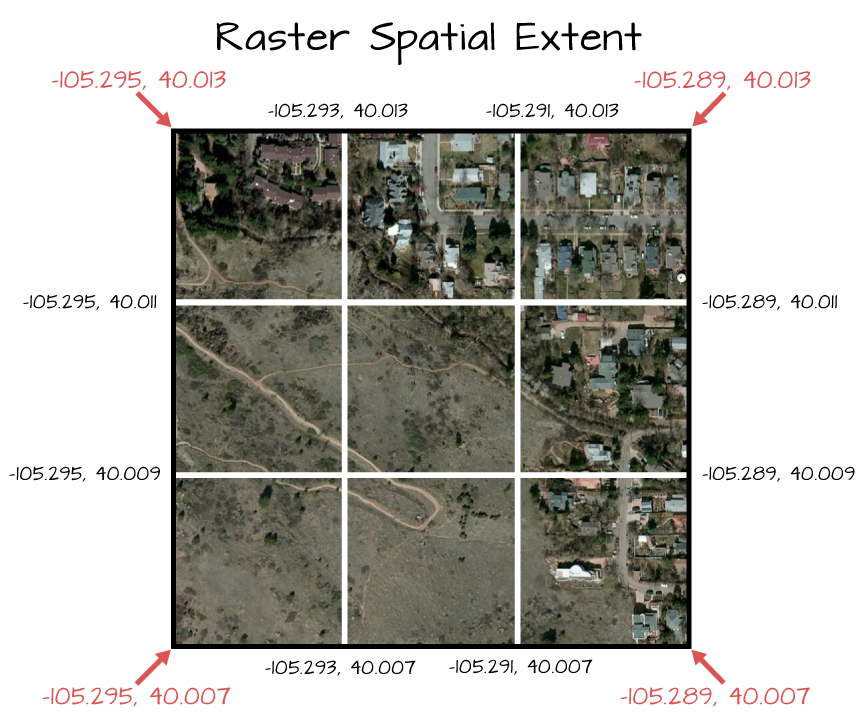
Figure 13 Satellite raster data.
Raster data is typically stored in two formats: TIFF and JPEG2000. TIFF(Tagged Image File Format) is a widely used raster image format for storing and exchanging digital images. It is a flexible format that can store a variety of data types, including color and various spatial resolutions, and supports lossless compression. GeoTIFF is a variant of the TIFF format that includes geospatial metadata, such as coordinate reference system (CRS) information and projection parameters.
JPEG2000 is a newer raster image format that was designed to overcome some of the limitations of the JPEG format. It uses wavelet compression, which allows for higher compression ratios with less loss of image quality compared to JPEG. JPEG2000 is less commonly used than TIFF and is mainly used for image-like raster data such as RGB format, rather than for every spatial resolution like TIFF.
What I love about the geospatial community is their commitment to open-source and cloud-based technologies. The challenge of storing and utilizing whole Earth raster images has led to the development of more cloud-specific formats, such as Zarr, COG, and netCDF.
Figure 14 Ah, cloud computing and big data.
NetCDF (network Common Data Form) is a file format and data model for storing and sharing scientific data in a platform-independent and self-describing way. The netCDF data model is based on a hierarchical structure of dimensions, variables, and attributes. A netCDF file can contain one or more variables, each of which has a name, data type, and dimensions that define its shape. Variables can be multidimensional, and each dimension can have a name and a size.
Zarr is a format for storing array data that is designed for efficient storage and retrieval of large, multi-dimensional arrays. It supports a range of compression and encoding options to optimize data storage, and can be easily chunked and distributed across multiple nodes for parallel processing. Zarr is often used for storing large, multidimensional arrays of satellite imagery or other geospatial data, and is supported by a range of open-source libraries and cloud storage services.
COG (Cloud-Optimized GeoTIFF), on the other hand, is a format for storing geospatial raster data in a way that enables efficient access and processing in cloud environments. COG files are regular GeoTIFF files that have been structured to enable efficient access to specific subsets of the data without the need to read the entire file. COG files can be efficiently streamed over the internet, and can be easily accessed and processed using a range of open-source tools and cloud services. COG files are often used for storing and distributing large collections of geospatial data, such as satellite imagery or topographic maps.

Figure 15 What to choose.
In general, netCDF is best suited for storing and working with large scientific datasets that require multidimensional arrays of numerical data, such as climate model output and oceanographic data. While the other mentioned formats are widely used for raster data, I have witnessed that COGs are more commonly used than zarr in the geospatial community. However, in geodevelopers communities, zarr is becoming increasingly popular for big data geoscience, such as those using Pangeo. As both formats are well-suited for big data cloud reading, I would choose zarr because it is not specific to spatial data. Therefore, as a globally used format, it will be better maintained and developed. However, COG format may be much better suited since it is developed primarily with a focus on spatial raster images.
STAC
Finally, I want to discuss what STAC is. STAC (SpatioTemporal Asset Catalog) is a community-driven specification for organizing and sharing geospatial data as standardized, machine-readable metadata. It is designed to provide a uniform way of describing spatiotemporal data assets, such as satellite imagery, aerial photography, or other geospatial datasets, so they can be easily searched, discovered, and analyzed.
STAC provides a flexible metadata structure that can be used to describe a wide range of geospatial data assets, including their spatial and temporal coverage, resolution, format, quality, and other properties. With STAC metadata, users can enable various workflows, such as searching and discovering data assets, filtering and querying data based on specific criteria, and efficient access and processing of data in cloud environments.
STAC has gained popularity in the geospatial community as a way to standardize the way geospatial data is organized and shared. It makes it easier for users to discover and access the data they need. Many commercial and open-source geospatial tools and platforms have adopted STAC as a standard for organizing and sharing geospatial data. It can be used by government agencies, academic institutions, private companies, and non-profit organizations to manage and share their geospatial data.
In simpler terms, STAC is a hierarchical metadata structure that points to spatial data. It is widely used to analyze and find the necessary data without reading a large amount of data. It is lightweight and enables users to quickly pinpoint a range of SpatioTemporal data that they need, allowing them to load only the required data without the need for waiting hours for the data to load and use only a small percentage of it.
Coming Next 
In the next blog post, I will focus on demonstrating the Python tools that are used in satellite data processing and visualization, along with their application in AI and machine learning. The focus will be more practical, with an emphasis on how it is done rather than covering everything. I will also provide some cool frameworks and sources to explore further.
In this blog I intended to give you my knowledge about satellite and UAV data, which are frequently used or referenced in the field. While it would be ideal for data scientists or ML engineers to gain a deeper understanding of these concepts, it is not necessary to be a geography expert or have an extensive knowledge of the field.
Based on the understanding of this material, you can now begin to explore the application of computer science and machine learning in this field. It is crucial to understand the importance of processing big data in this domain, and you may have the task of helping people without computer science knowledge to optimize it effectively.
For Machine Learning researchers and engineers, I recommend exploring the following interesting research labs, publications, and works:
- EcoVision: The EcoVision Lab conducts research at the forefront of machine learning, computer vision, and remote sensing to address scientific questions in environmental sciences and geosciences. It was established at ETH Zurich by Prof. Dr. Jan Dirk Wegner.
- ECEO: The ECEO Lab conducts research at the intersection of machine learning, remote sensing, and environmental science. It was established at EPFL by Prof. Devis Tuia.
- Geoscience Australia: Geoscience Australia is a government institute that focuses on earth science for Australia’s future.
I also recommend the following sources, as they provide more information on geospatial data experience for machine learning developers:
- GeoAwesome: The world’s largest geospatial community (They say so on their website), where geospatial experts and enthusiasts share their passion, knowledge, and expertise for all things geo. It features cool blogs and podcasts.
- satellite-image-deep-learning: A newsletter that summarizes the latest developments in the domain of deep learning applied to satellite and aerial imagery. The author also creates a course in this domain.
- STAC example of working with Sentinel-2 data from AWS.
- Workshop on raster processing using python tools.
- STAC Best Practices official readme.
- Radiant Earth Foundation: An American non-profit organization founded in 2016, whose goal is to apply machine learning for Earth observation to meet the Sustainable Development Goals. They support the STAC project and other interesting projects.
- Pangeo: A community platform for Big Data geoscience. Promotes popular Python geoframeworks with a modern approach to community and tool development/support.
- Picterra: The “leading” platform for geospatial MLOps. They have great blogs, and you can check how MLOps looks for geospatial problems.
